Current weather conditions Guatemala

|
WEATHER FOR CENTRAL AMERICA AND THE CARIBBEAN / GULF OF MEXICO Especially for the Mariner. See Also: Tide Tables and Maritime Mobile Net Frequencies |
To see all the information presented here, you would have to navigate to many different web pages.
|
Solar Conditions / Radio Propagation Current Horizontal Surface Current Velocity |
Special Tropical Surface Analysis Showing Cyclones, Tropical Convection / Thunderstorms and Tropical Waves) 48-Hour Peak Wave Period and Swell Direction Tropical Cyclone Danger Areas Gulf of Mexico Special Surface Analysis Detail (Showing Cyclones, Tropical Convection, Thunderstorms and Tropical Waves |

Solar Conditions / Radio Propagation
The new GOES East satellite (GOES 16) is an amazing machine and a big improvement over its predecessor. It provides more frequency bands and higher resolution, up to 7000x7000. To see more of what it can do, try this link: https://www.weather.gov/crp/satellite. The high resolution animations are a sight to behold.
Latest Tropical Atlantic GEOCOLOR
The GEOCOLOR image shows visible full color during daytime plus composite infrared at night. This image extends from Central America to the west coast of Africa.

Latest Tropical Atlantic 10 um IR (longwave)
This wavelength is good for viewing clouds in infrared. The image extends from Central America to the west coast of Africa, yet provides enough resolution to watch thunderstorms developing over Guatemala. For more control and higher resolution, explore the link given above.

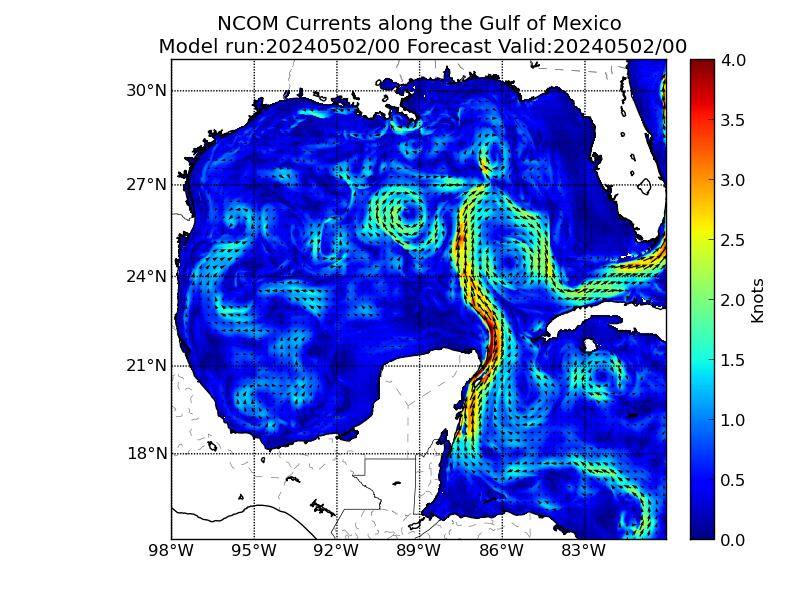
Current Currents, Gulf of Mexico (Zero hours, now)
From NOAA OPC (Ocean Prediction Center)
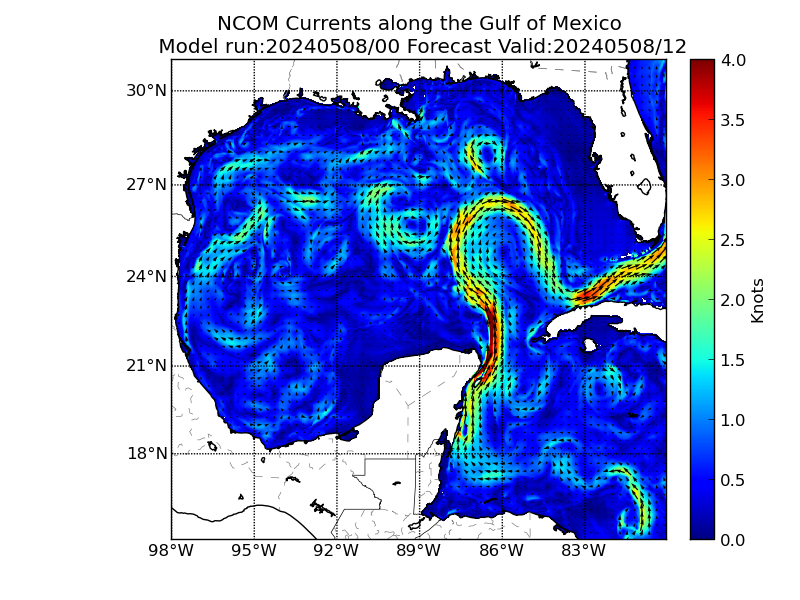
Twelve Hour Forecast Currents, Gulf of Mexico
From NOAA OPC (Ocean Prediction Center)
From NOAA OSPO (Office of Satellite and Product Operations)
This is a large image that can be scrolled.
NHC 5-Day Tropical Weather Outlook
From NOAA NHC (National Hurricane Center)
This is a large image that can be scrolled.

Specialized
Tropical Surface Analysis
Showing Thunderstorms, Cyclones,
Tropical Convection, and Tropical Waves

48 Hour Peak Wave Period / Swell Direction
Tropical Cyclone Danger Areas
(Mariner's 1-2-3)
Note: The Tropical Cyclone Danger Areas graphic is only issued from May 15 to November 30
Gulf of Mexico Surface
Analysis Detail Showing
Cyclones, Tropical Convection / Thunderstorms
and Tropical Waves
A subsection of the Tropical Surface Analysis covering the region from 15°N to 35°N, 75°W to 105°W.
See Also: Tide Tables and Maritime Mobile Net Frequencies
Hurricane Quiz (New)
May 26, 2019
© 1997-2019 Phillip Landmeier